Debugging The Frontend In VS Code
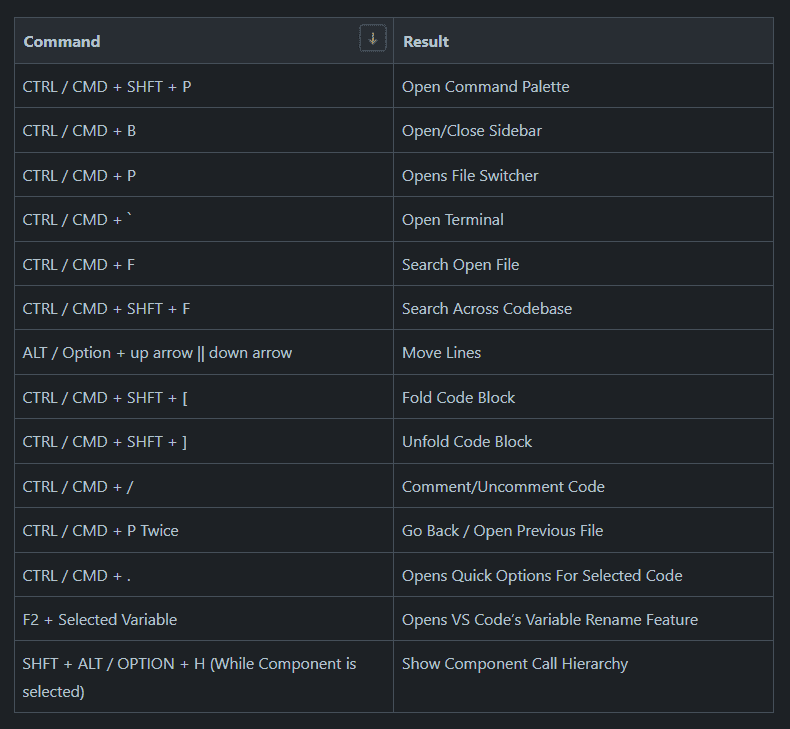
Keyboard Shortcuts
Useful Keyboard Shortcuts Above The Standard Copy/Paste/Cut
The debugger in chrome and being able to add break points is great, but it’s even better being able to do it in VS Code. To do this:
- Open the debugger in VS Code.
- Click "Run and Debug".
- Click ‘Web App (Chrome). This should setup a launch.json file.
- You need to change the 'URL' and 'webroot' to match the URL your app runs on, and the root of your app. Save your changes.
- While the app is running, Go to the debugger, select ‘Launch Chrome’, and press play.
- You can now add breakpoints to your code in vs code.
Useful Extensions
- Prettier Typescript Errors - Formats typescript errors in a more readable way
- Git History - Shows git history, who changed the line last, what the file looked like before, ect
- Github Copilot - An incredibly useful coding companion
- Code Spell Checker - Points out spelling mistakes in your code
- Docker - Easily manage your docker info from VSCode
